Introduction
Nutrient density – just what exactly does it mean? In the first part of this two-part series, I took at look at Dr. Fuhrmann’s and Mat Lalonde’s work on nutrient density. In short – Dr. Fuhrmann based his calculation on “Nutrients per Calorie”, and his nutrient-selection for this analysis was suspect at best. Mat Lalonde stuck to known essential nutrients, and his formula included a rigorous statistical analysis, but basically worked out to “Essential Nutrients per Unit Mass”. Overall, I agreed with Lalonde’s approach for the most part, while Fuhrmann’s work seemed biased towards vegetables on purpose, and ignored the valuable contributions from animal foods.
That said, I think Fuhrmann’s analysis does illustrate that there are indeed foods that provide a lot of nutrients while providing little to no calories, and that these can be considered valuable foods. His mistake, I believe, is recommending that the majority of people get 30-60% of their calories from these calorie-poor foods. It leads to absurd quantities of food, and highly excessive micronutrient doses. To be fair to Fuhrmann, and as I’ll discuss below, I do think that too many people consume too much low-nutrient, calorie-rich food, but it’s generally in the processed-food realm (doughnuts and soda), and not usually calorie-rich natural foods (with some exception).
This time around, will be my take on nutrient density! I’m going to plot a few things up and show just how nutrient dense some foods are, but that it’s also very difficult to compare the ‘nutrient densities’ of very different types of foods.
Initial Thoughts
Before we get started on looking at which foods are the “most nutrient dense”, it’s worth considering the extreme variety that exists within different foods. Beef is a very different food than strawberries, which is a very different food from almonds, which is a very different food from basil, which is a very different food from eggs, and so on. To try to rank foods using one ranking system might not even really make sense. The relative amounts of protein/fats/carbs in foods varies greatly, as does the water content, fiber content, mineral content, anti-nutrient content, and every other aspect of what makes food, “food”.
I’ve been thinking about this concept for months now, and I really can’t think of a way to compare every single type of food using one “nutrient density” ranking system. Now, that doesn’t mean that it doesn’t exist, but that in my time thinking about it, I’ve come across a lot of challenges to define that system. I also question the value of that particular system as it may just make dietary recommendations unclear.
I mean, humans are obviously omnivorous (by nature, by choice is a different matter), and there’s a school of thought that being able to eat and do well on a wide variety of foods is a serious advantage, and could be the reason that humans evolved to dominate the planet. Having access to and being nourished by a wide variety of foods is preferable to identifying one or two “best” foods (or groups of foods), and strictly consuming those. Times change, and we have to be adaptable, and be able to thrive under very different circumstances.
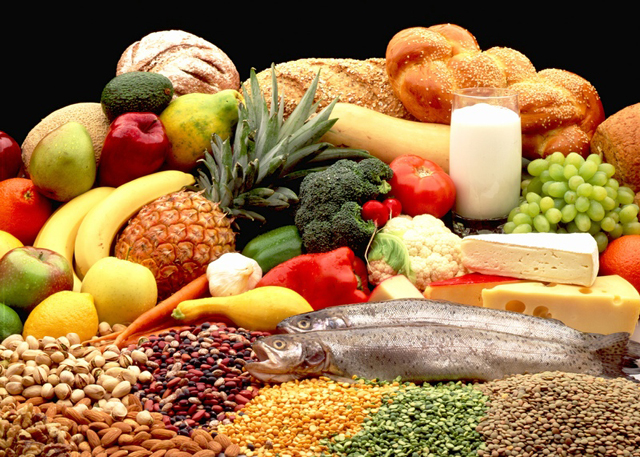
I dug up some information (from the USDA Nutrient Database) on just how different most foods are, and graphed them out as best as I could with the time I had available. I chose a few common foods from what I would consider the most common food types (animal flesh, dairy, vegetables, tubers, fruits, grains, legumes, oils), to simplify things as opposed to looking at every single food in the database (for that, see Mat Lalonde’s work). The foods I chose for this analysis are:
- Butter
- Olive oil
- Whole milk
- Cheddar cheese
- Eggs
- Bacon
- Salmon
- Grass-fed ground beef
- Conventional (corn fed?) ground beef
- Beef liver
- Chicken liver
- Chicken breast
- Sweet potatoes
- Potatoes (russet)
- Almonds
- Apples
- Bananas
- Oranges
- Strawberries
- Blueberries
- Broccoli
- Kale
- Cabbage
- Spinach
- Tomato
- White bread
- Brown bread
- White rice
- Brown rice
- Buckwheat
- Kidney beans
- Black beans
- Lentils
- Soybeans
- Quinoa
Fruits and veggies are all raw, whereas all meats, grains, and legumes are cooked. One potential exception: I’m not sure what state the buckwheat is in.
For all the graphs that come, I tried to put a lot of information in there, and the images came out small in the article. To read the graphs properly, I suggest you click on them so they load in a separate window, and read them there. Unfortunately, this might be tricky to do on a phone. Science is hard! 
Water and Macronutrient Concentrations
One of the first things I started considering when thinking about nutrient concentrations in foods was the water content. I remembered being a kid and being taught that a lot of foods are almost entirely water (I took pride in memorizing and reciting this information). So, using the data I had, I plotted up a how many grams of water is in 100 g of all these foods (effectively % by mass). Here it is:
Water Content in 100 g of Foods: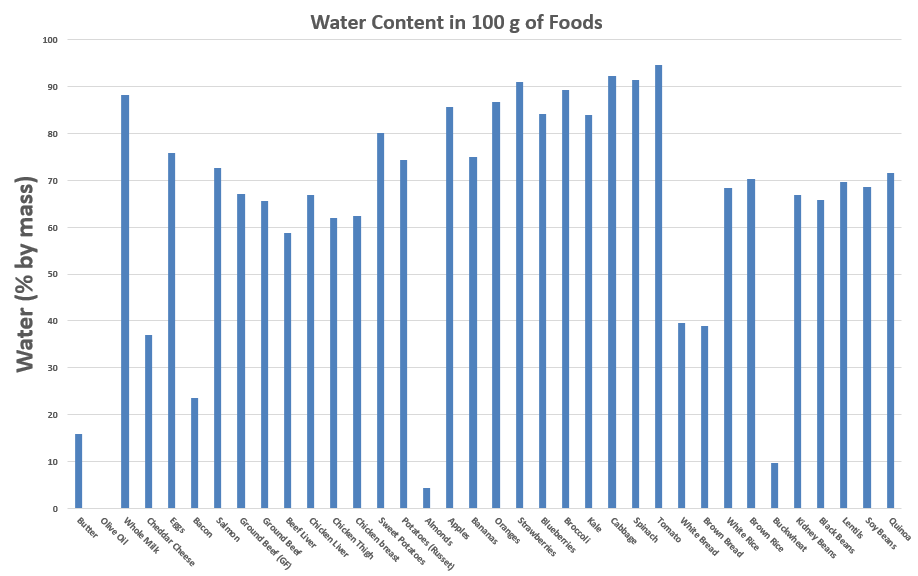
Of all these foods, only one contains zero water: olive oil. That makes sense to me. Most of us are aware that water and oil do not mix. There’s a bit of water in butter, which is also mostly oil/fat, but it makes sense as it comes from milk which is close to 90% water. There’s little water in almonds, which is interesting, and also little water in buckwheat. Bacon is also light on water, but is still over 20%.
Otherwise, it becomes clear that the majority of foods are mostly water, or water is a major component. One exception could be dried foods (fruits, grains, veggies), which would have the water component significantly reduced, thus changing it’s nutrient concentrations (by gram, not by calorie). So – right off the bat, it’s tough to compare foods that are mostly water to a food that contains almost no water. That’s a key difference. In terms of energy or nutrients per gram of a food, foods that are mostly water are going to look very different from foods that contain almost no water. Ranking them on the same scale is going to be tough, and there may be no point to it. If we were to rank them on nutrients per calorie (Fuhrmann style), water levels would have no effect, but that system has limitations as well (last article).
As I showed before when looking at the Fuhrmann scale, foods also have highly varying macronutrient content. By this I mean the relative total amounts, and proportions, of proteins/fats/carbohydrates are going to be very different. All the macronutrients provide energy (calories, or kcal) in different amounts, which is why I have decided to use calories as a proxy for overall macronutrient levels. In 100 g of the selected foods, calorie counts are as follows:
Metabolic Energy in 100 g of Foods: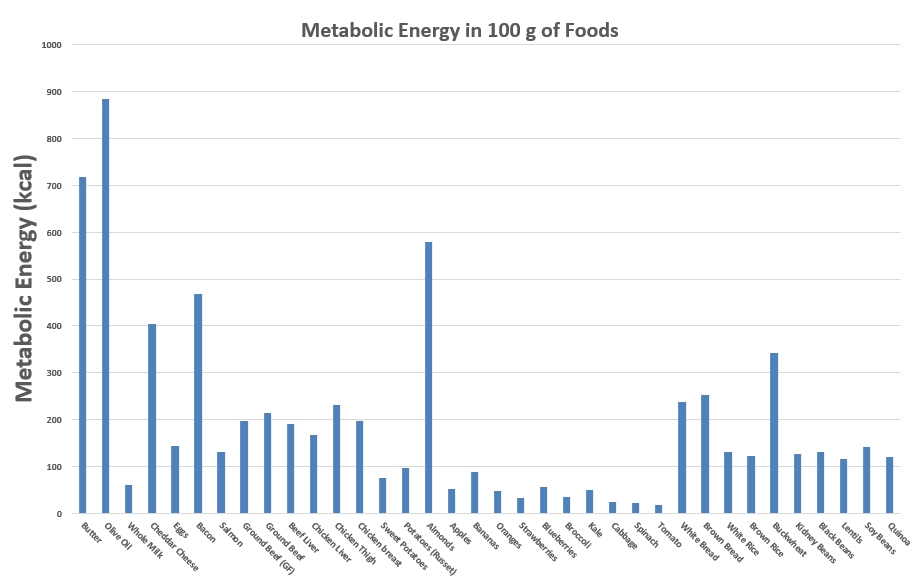
The energy-dense winners are the oils. Specifically, Olive Oil comes in at almost 900 calories per 100 g. The tomato comes in at 18 calories per 100 g. That’s a massive difference. These foods clearly can’t be directly compared to each other. Forget the phrase “it’s like comparing apples to oranges”, this is a new league of “comparing olive oil to tomatoes”, which makes sense as olive oil and tomatoes are used for entirely different purposes.
In general, fruits and veggies contain very few calories, and grains and legumes are roughly equal in calories to most animal foods (other than bacon, haha). Both white and brown bread contain more calories per gram than any animal food in this dataset other than bacon and cheese, but not significantly so.
I ignored the difference in carbs and fats in this analysis (to simplify), but to get a little more specific with our macronutrients, let’s take a look at what a lot of people are interested in: protein! Now, there’s more to protein in food than just the total amount. We’d have to look at specifically what amino acids are present in what quantities to really judge the differences. Also, the research is clear that the digestibility and quality of proteins from plants is lower than animal proteins, but we’re going to ignore that for now (too complicated for this post) and just look at the total amount:
Protein in 100 g of Foods:
To start, none of the oils, fruits, or vegetables contain any appreciable protein content (by mass). They just don’t. Kale and broccoli have the most protein out of these veggies, but both are under 5g/100g. You’d have to consume vast mountains of them to get any significant protein, and the quality and digestibility is low anyway. Ignoring the quality concerns, nuts, grains (except for white/brown rice), and legumes have a decent amount of protein as compared to veggies and fruits, but animal foods clearly have much higher amounts of protein. One exception: eggs! That’s less than I thought. Looks like there’s water and fat getting in the way. Interesting. That said – the quality of egg protein is high which is probably why it has a “high protein” reputation.
I must admit I was pretty shocked to see the winner on this one: bacon! After thinking about it though, it’s clear from the above data that bacon has the least amount of water in the meats by a long shot (24% vs the next lowest being beef liver at 59%), so bacon is much more concentrated. Does this make it BETTER than the other meats? I can’t really say. You’d need less of it (by mass) to get similar amounts of protein and calories, but it’s more complicated than that. If you wanted a lot of protein and relatively few calories, you’d be better off with chicken breast.
To make it more clear, 100 g of chicken breast contains 197 calories and 30 g of protein. 100 g of bacon contains 468 calories and 34 g of protein. For those same 468 calories, if you chose chicken breast, you’d get 71 g of protein.
If you wanted to get a lot of calories and didn’t care as much about protein, bacon would be fine and would require less overall food (less mass). For me – a nice combination sounds good I can’t really say one is better than the other. They’re different. Same with comparing beef to kale. You can’t really say which is better. Clearly beef has more protein and calories per gram, but does that alone make it better? Let’s see in the next section.
Ok that’s enough about the differences in macronutrients. Time to go smaller, and think about the micronutrients (vitamins and minerals and the like).
Micronutrient Concentrations
Micronutrients are your vitamins and minerals. They don’t provide energy, but you will die without them. So – for a set amount of calories over time that you get from food, those same foods (or supplements or whatever) have to provide the right amounts of micronutrients as well. It is possible to be malnourished on micronutrients while consuming excessive calories (e.g. a high sugar/high fat diet with little else), while it’s also possible to get enough micronutrients and not enough calories (nothing but lean beef and broccoli!). This is where Fuhrmann came in and said “let’s MAXIMIZE nutrients per calorie to MAXIMIZE health”. Again – he chose some wacky micronutrients, but provided you get enough calories, you can see where he’s coming from. It kinda makes sense.
What I’ve done in this section is take 100 g and 100 calorie servings of a smaller number of foods (from the same data set, just less of them), and see what those servings provide in terms of the % Recommended Dietary Allowance (%RDA) from 1997’s Dietary Reference Intake (DRI). The RDA is the daily intake required to meet the nutritional demand of 97-98% of healthy people. This is old now (well, 19 years old), but it’s still the best we have. So – 100% on a given day for a certain nutrient means you’re hitting your RDA for that nutrient. Once you’ve accomplished that, I’m not sure there’s a benefit to getting much more. Maybe? Going over 100% on one day and under 100% on another is totally normal. Your body can store nutrients. Either way – these are the guidelines I’m working with. These are the micronutrients that the USDA database provides that I was able to line up with RDA’s:
- Calcium
- Iron
- Magnesium
- Phosphorus
- Potassium
- Zinc
- Vitamin C
- Thiamin
- Riboflavin
- Niacin
- Vitamin B-6
- Folate
- Vitamin B-12
- Vitamin A, RAE (Retinol Activity Equivalent – that’s the good stuff)
- Vitamin E (alpha form)
- Vitamin K
The next graph shows the %RDA of these essential nutrients 100 g servings. You’ll definitely need to click on these graphs to have them open in a separate window to see the data in all it’s glory.
100 g Servings of Foods – Calories Vary – %RDA of Various Nutrients: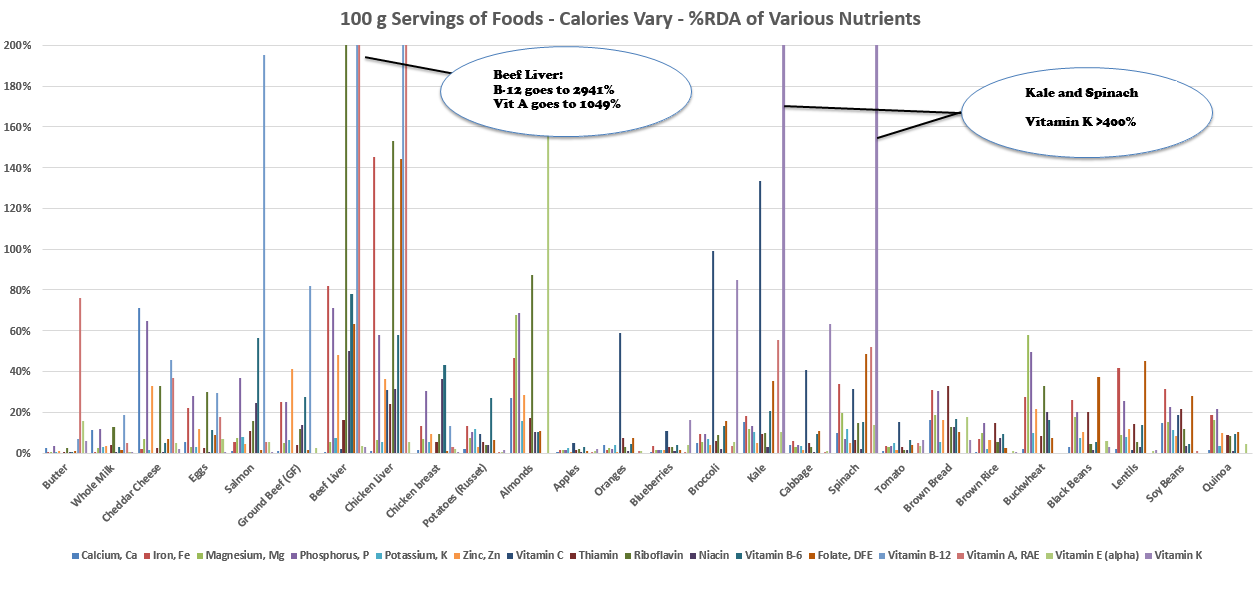
So – based on mass, the big winners are the beef and chicken liver, and kale and spinach. Beef liver is insane – 100 g gives your 2941% of your daily B12 needs, and over 1000% of your daily Vitamin A needs. It boasts everything else in high amounts as well. Chicken liver also has some massive spikes there. Salmon is looking good on the B12 front. Cheese has the most calcium, by a long shot, compared to any other food on the list. Buckwheat is the magnesium champ. Almonds are the Vitamin E amigos. Kale and spinach are absolutely killing it with Vitamin K, and have solid amounts of other nutrients too. Most foods have something across the board, with the exception that there is no plant source of Vitamin B-12. Now, ignoring the differences in mineral absorption between plant and animal foods, grains and legumes are comparable to ground beef and chicken breast. There seems to be as much variation within legumes are there is between meat and legumes…again, with the exception that there is no B-12 in the legumes, and the minerals from legumes are hard to absorb. Variations are huge, but I digress.
The surprising loser in this study? FRUIT! Although I truly believe moderate amounts of fruit are healthy, and there are antioxidants that aren’t plotted here, it’s clear by the lack of anything in the middle of that graph that fruit is delivering very little with regards to micronutrients compared to other foods. One exception is the big spike in Vitamin C for oranges, but hey, broccoli and kale have more…I’m not going to stop eating fruit anytime soon, but it’s worth considering that other foods have higher nutrient concentrations, especially liver and broccoli/kale/spinach. An apple a day keeps the doctor away, eh? I wonder if that was just apple marketing, haha.
OK next graph will plot this same information, but for 100 calorie servings of all the same foods.
100 kcal Servings of Foods – Mass Varies – %RDA of Various Nutrients: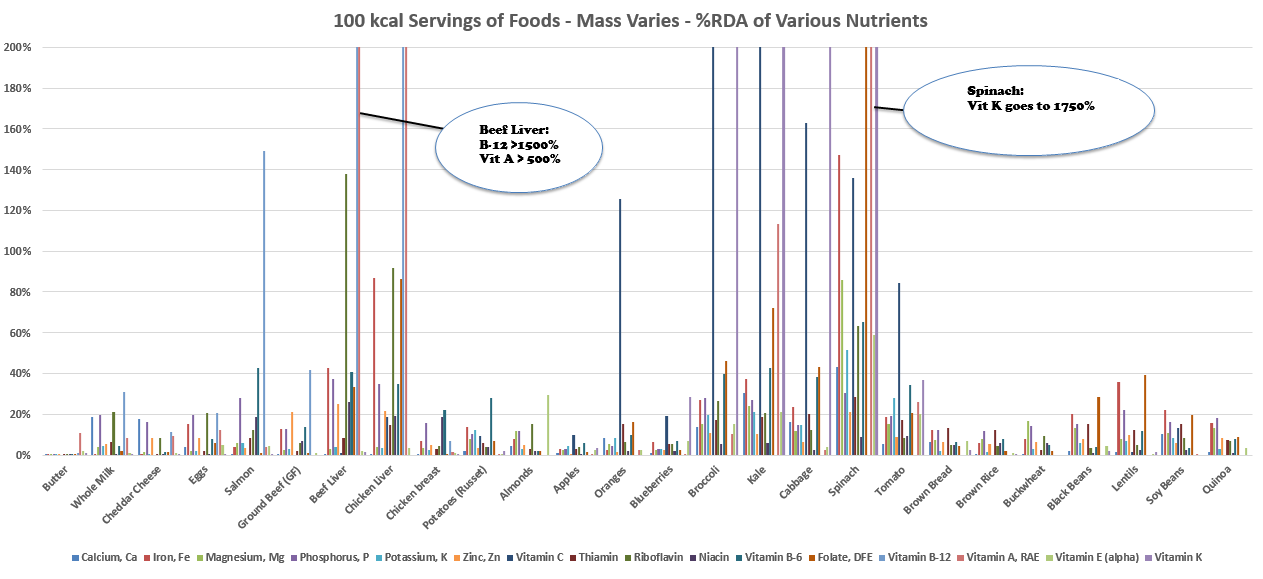
Butter, per calorie, does not have much with regards to micronutrients. Fair enough! Vitamin A though…alright!
Non-starchy veggies are looking pretty great now! And I think that’s the point: Vegetables contain valuable micronutrients, and very few calories. I feel like their role in the diet is exactly that – not to provide substantial calories, but to provide substantial nutrients. Keep in mind – there is no B12 in the veggies. The amount of Vitamin K in 100 calories spinach is at an eye-popping 1,750%. Granted, to get 100 calories from spinach, you’d need to eat almost a pound of it.
Beef and chicken liver still look really good, while also providing high quality protein (as shown above) that is not plotted on this particular graph.
Once again – fruit is not offering as much as other foods, but hey, I think fresh, in-season fruit is amazingly delicious, and provides some nutrients along with simple sugars.
Even the foods that look low in micronutrients, keep in mind that this is for 100 calories, when most people need 2,000+ calories per day for their metabolism. So even if a food offers 5% of the RDA of a nutrient in 100 calories, if you got 2,000 calories worth of this food, that’d be enough! Not every food has to be blasting huge amounts of nutrients into your body. Seems like most foods are just fine.
The real problem foods are the ones that contribute a LOT of calories, with little to no micronutrients. In reality, this is only refined sugar and oils and prepared foods made up of refined sugar and oils, and nobody in their right mind would think this is a healthy basis for a diet. So – those of us living off donuts, cookies, chips, and soda are going to have a problem. For those of us where highly processed foods are a rare treat, and we otherwise stick to whole foods (meats, veggies, fruits, nuts, legumes, even some grains), I think we’re going to be OK without stressing out over which foods are the best. That said – I would still encourage you to eat at least some liver and green vegetables to make sure you’re all topped up.
By varying the types of whole foods you are eating, getting enough food overall, and throwing in at least some amount of the identified superheroes such as liver, kale, and/or spinach, you’re going to get what you need. No stress
Conclusions:
OK – here I am at the end of this analysis, and I still don’t have a nutrient density scale for you. To me, that’s what I’ve discovered: I think it’s largely unnecessary. The variation in nutrient levels (both macro and micro) across different foods is vast. It’s nearly impossible to put them all on some scale and say that some foods are way better than others, other than the extreme cases identified.
Here are my conclusions, in point form:
- Liver(s), and dark green veggies (broccoli, kale, spinach) are foods with extremely high concentrations of certain nutrients, and good amounts of lots of others
- This does not mean we should exclusively eat liver and dark green vegetables, but they are undoubtedly valuable and should be consumed to some degree
- Animal foods have more protein, and higher quality protein than plant foods
- Legumes and nuts still have appreciable levels of protein
- Fruit is low in micronutrients (per gram and per calorie) compared to animal foods, vegetables, and legumes
- Fruit is still valuable as a delicious and convenient source of calories
- To get all the nutrients you need (macro and micro, including overall calories) variety in food intake is necessary
- As long as you’re not consuming pure sugar or pure fat for the majority of your calories and largely eating whole foods for your calories, you’re going to get the micronutrients you need. No sweat.
So that’s it! Any thoughts, readers? I’m ready to put this one to bed.
G
ADDENDUM: More graphs (fats and carbs)
Carbohydrate Content in 100 g of Foods: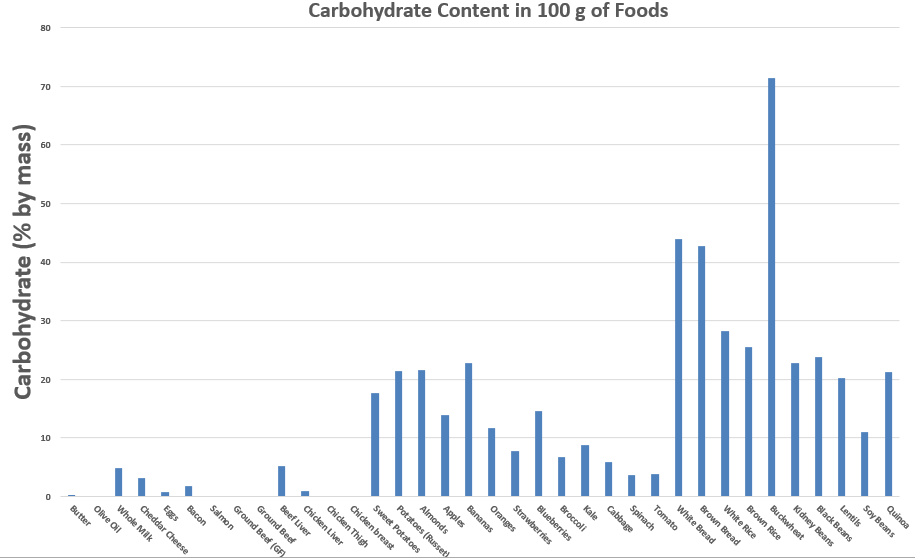
Fat Content in 100 g of Foods: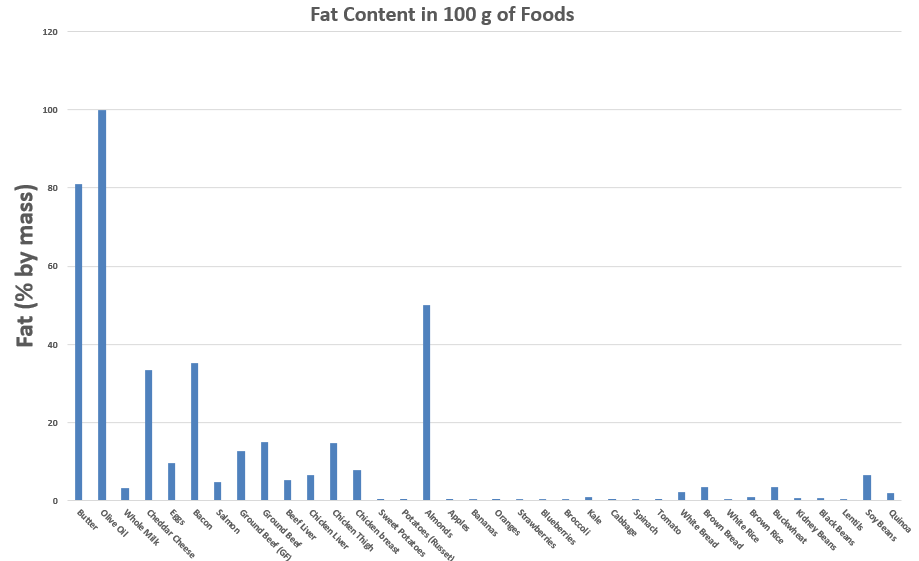
Hello,
Nutrient density is important and its importance increases if you happen to be on a calorie restricted diet.
As it happens many of the foods that are nutrient dense are also calorie sparse.
If your goal is to create a calorie deficit – a negative energy balance – in order to lose weight, it is essential to maintain nutrient intake by ensuring you focus on nutrient dense foods.
With this in mind, those on a low calorie or very low calorie diet VLCD are often directed to protein supplements. While I think protein supplements have their place, in this sitation 100 kcal of whey protein isolate for example would be trumped by the same number of organic beef calories. Beef in addition to protein would supply an abundance of other nutrients, alongside protein.
Thanks, Nico.
Thanks for the comment, Nico!
I agree completely. I love whole foods rather than just supplements.
My only ‘beef’ (hah) with the concept of nutrient density is that there I can’t come up with a nutrient density calculation that would apply equally to all foods…that scale may not exist, or maybe someone more qualified has to come up with it
I agree though – whole foods supply micronutrients in combination with the macros. I like your beef vs whey protein example. That said – you’d get more protein out of the 100 kcal of whey protein than the 100 kcal of beef. By my calculations, it’d be about 20-22 g protein from the whey powder, and if we’re using grass-fed ground beef (somewhat fatty mind), we’re looking at 9.8 g protein. Just depends what you’re looking for.
Graham
I really appreciate all the time, effort and analysis that went into this post! I also love your point form conclusions.
Seems pretty intuitive – variety is key! Thanks for a great read!
As always, great read. I need to step up my buckwheat game! Comparing olive oil to tomatoes is definitely not worth it; but the science community will continue to try to put this in some sort of full multi-variable, multi-macro, multi-micro nonsensical scale. Those graphs are useful… would be good to have the same ones for carbs and fats/100g
I was surprised with buckwheat too! Solid nutrient levels (esp magnesium).
Ask and ye shall receive: I added in the fat/carbs graphs at the end. Thoughts?